


Is New Zealand sunny enough for solar?
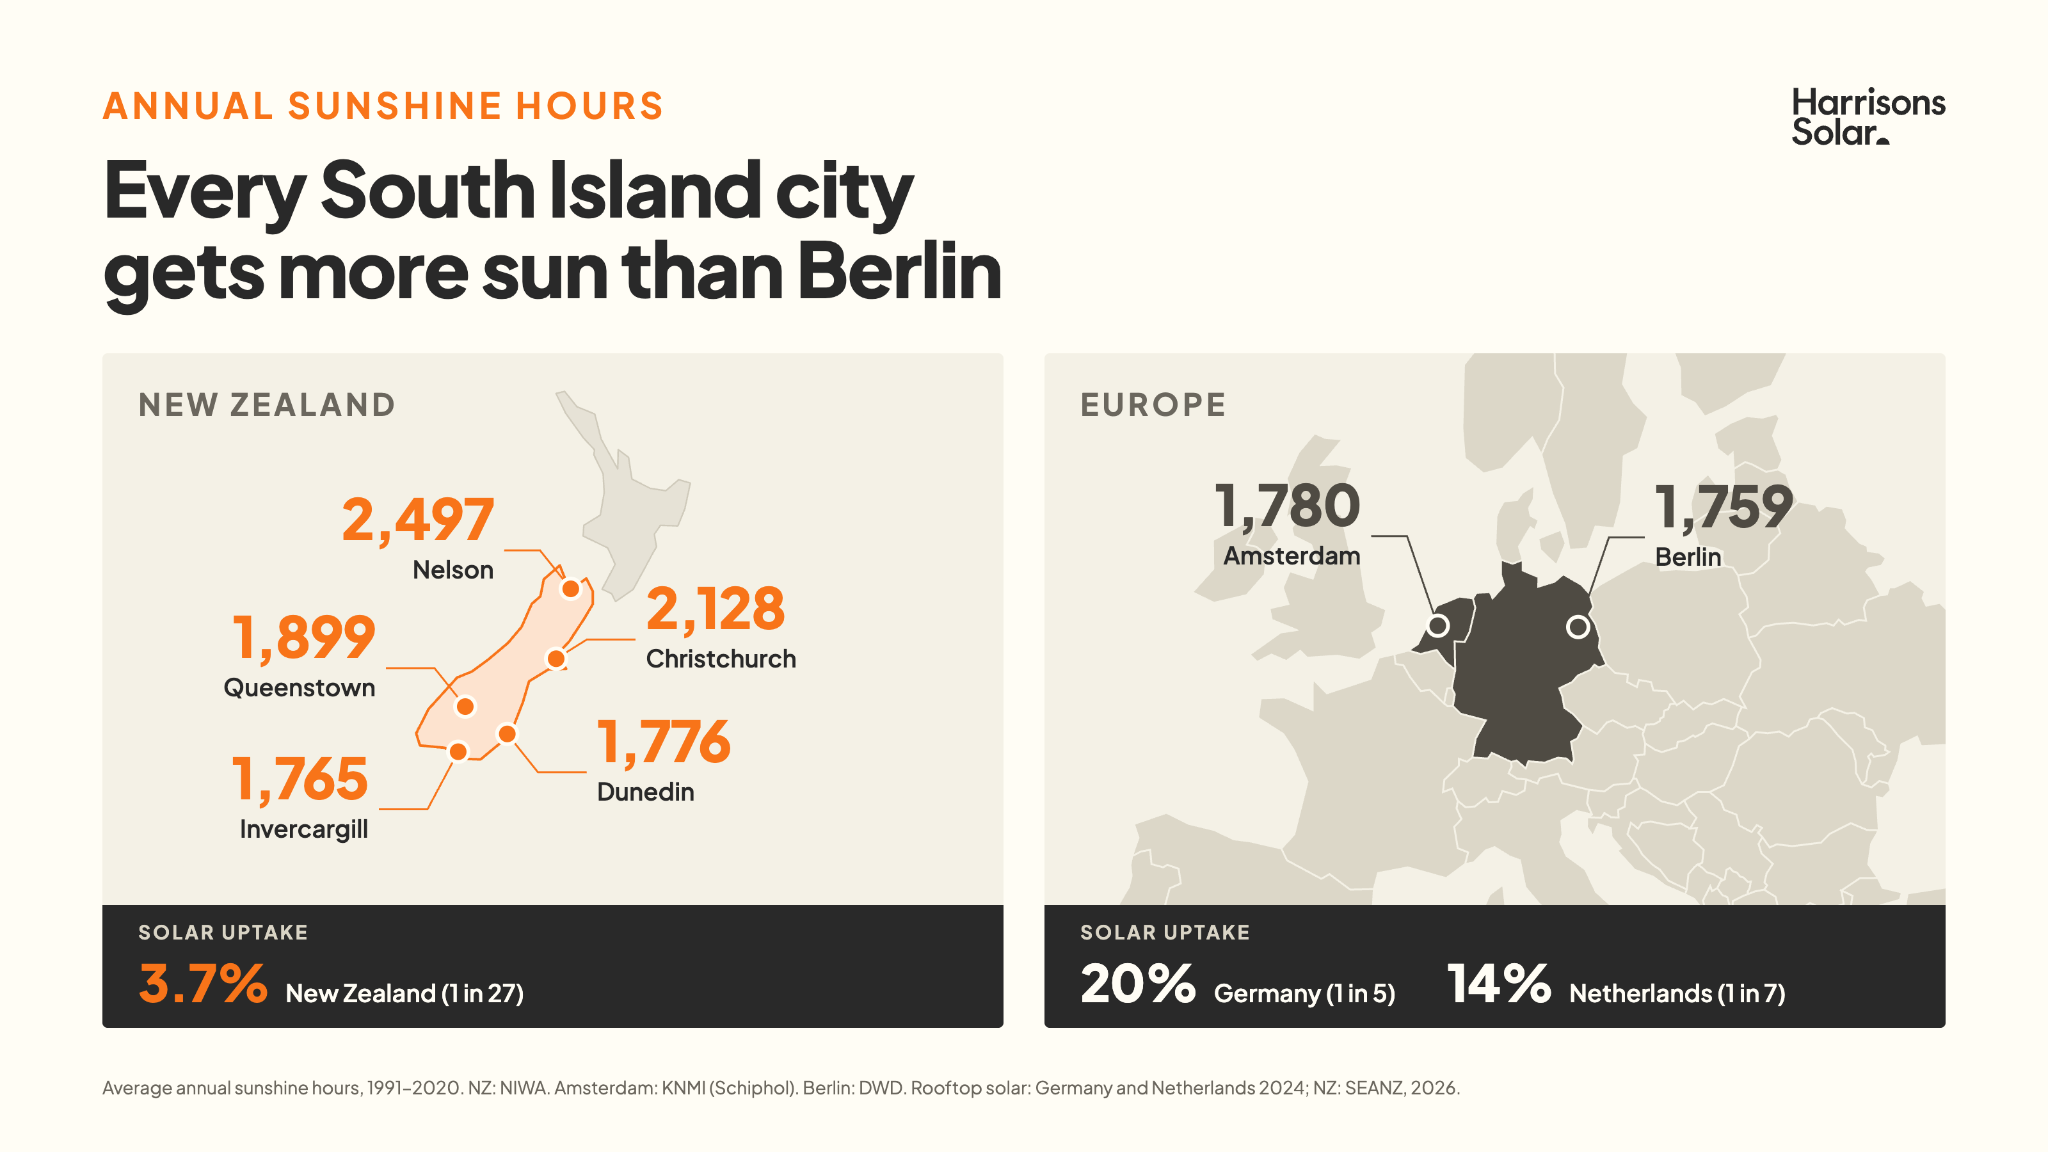
Every autumn, Shihad's Home Again does the rounds as the country's unofficial reminder to wind the clocks back.1 The good news is that we're in the other half of the year now. Daylight saving means longer, lighter evenings, and more of the sun where you can actually use it.
With all that extra daylight, a question comes up more often than you'd think... Is New Zealand actually sunny enough for solar?
We got asked exactly that recently in Invercargill by a potential customer. The answer is a big “hell yes!”, and the numbers back it up.
How do we stack up against the world's solar leaders?
Australia is the obvious comparison, and yes, they're well ahead of us, with more than 1 in 3 homes running solar.2 But Australia also gets a lot more sun, so it's not really a fair fight.
The more telling comparison is with countries that get less sun than we do. Germany is one of the world's big solar success stories. By 2024, around 1 in 5 suitable rooftops there had solar panels. In the Netherlands it was around 1 in 7.3,4
Then there's the UK. Plenty of Kiwis have done their OE in London and come home with stories about permanent grey skies. Yet about 1 in 16 suitable UK rooftops have solar, and here it's about 1 in 27.3 We hate losing to the Poms almost as much as the Australians - this is a race we should be winning!
Now look at how much sunshine those countries actually get, next to ours… every figure below is a 30-year average for 1991-2020, so it's a like-for-like comparison.5,6,7
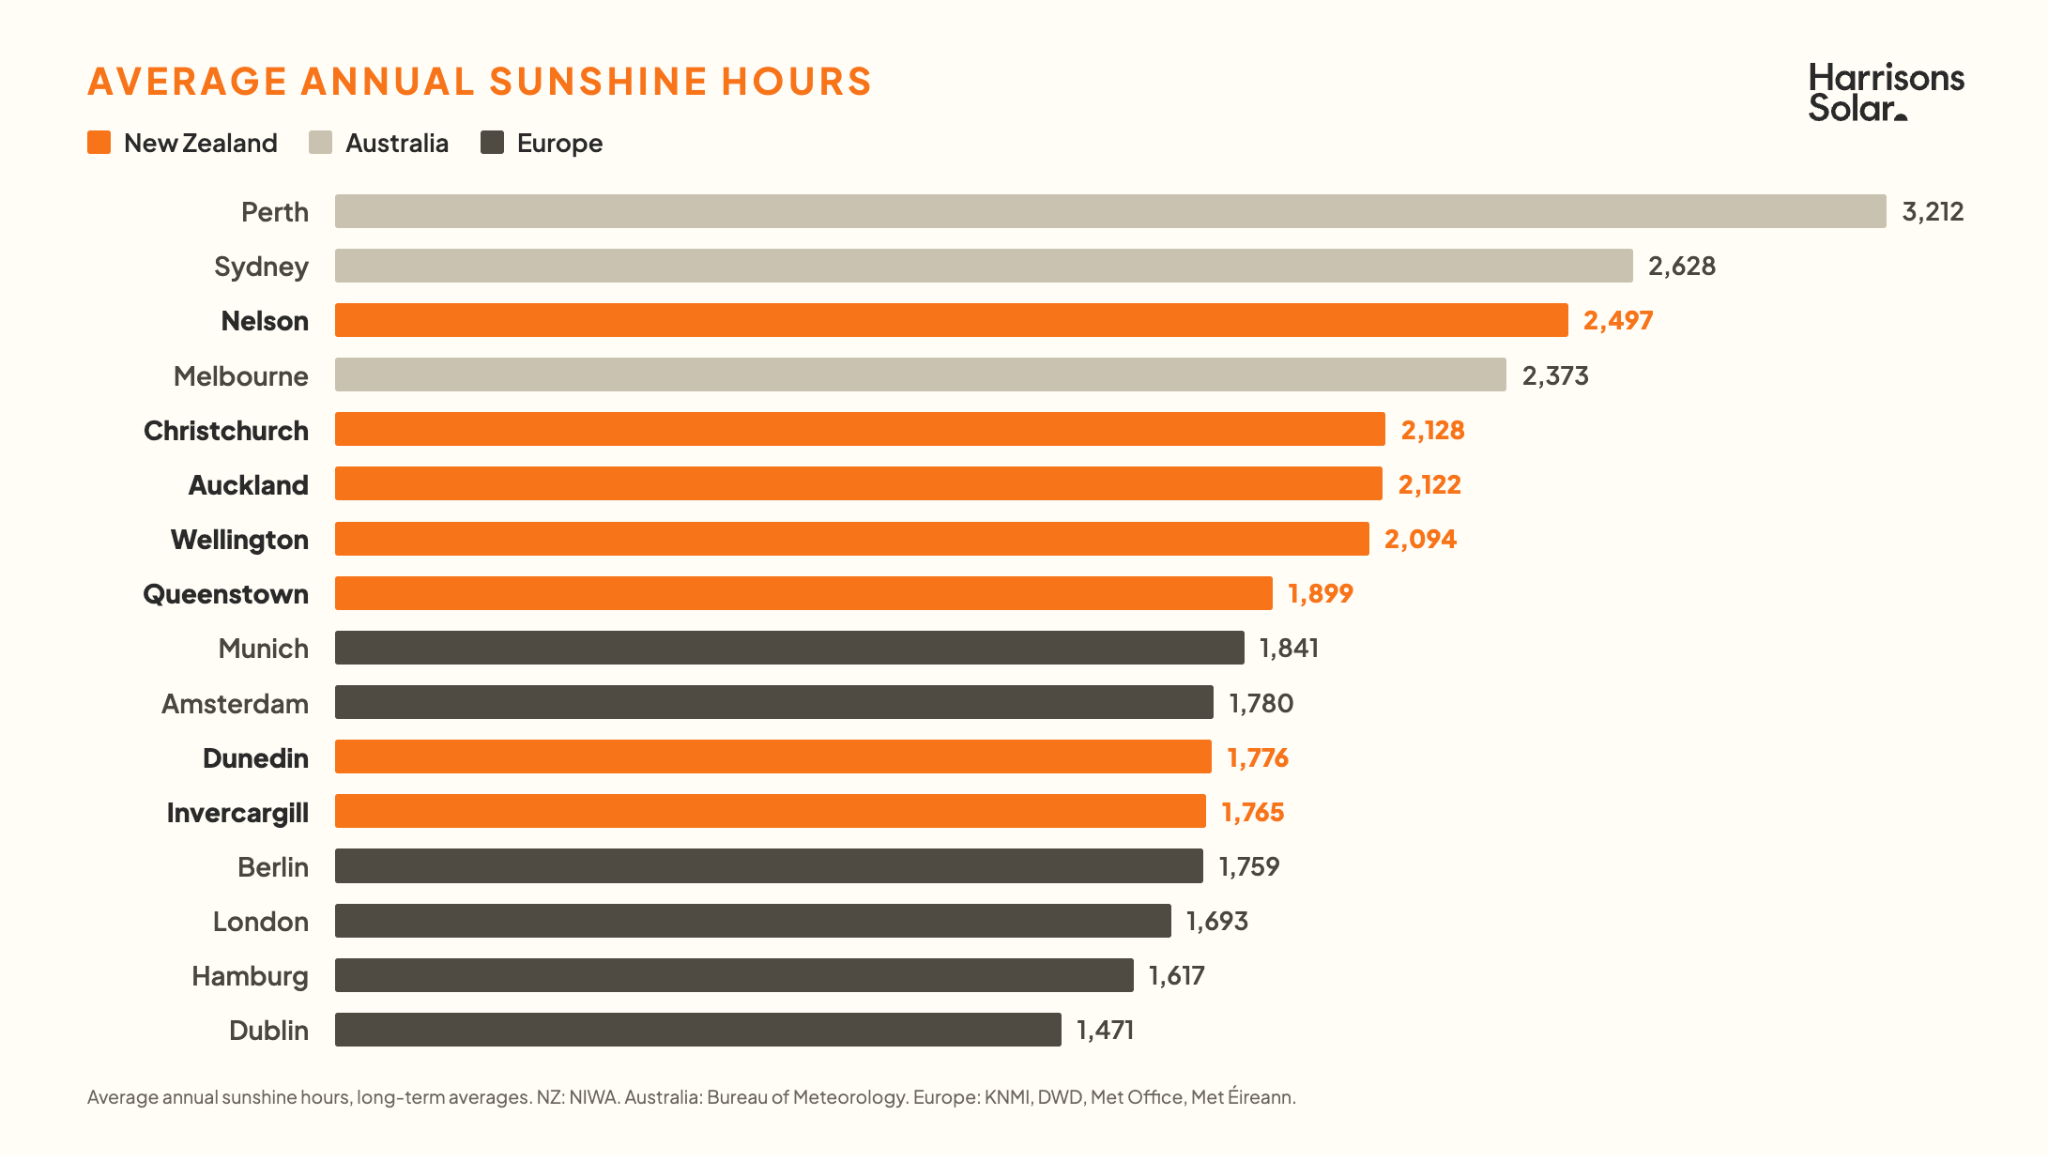
Every one of our main centres gets more sunshine than any of those European cities.
Queenstown is sunnier than Munich. And Invercargill, which gets a bit of stick for its weather, gets more sunshine than Berlin, London, Hamburg and Dublin, and about 96% of Munich's.
The funny thing is, Invercargill also has the lowest solar uptake in the country, at around 1% of suitable rooftops, and Southland as a whole sits at about 2%. Central Otago, just up the road, leads New Zealand at over 10%.3 The sun is there, and plenty of southern roofs are ready to be put to work.
If solar works on 1 in 5 suitable rooftops in Germany with generally less sun than Southland, it has a lot going for it in Invercargill!
Sunshine hours only tell half the story
Sunshine hours make a great headline, but they measure something different from what your panels actually run on.
- Sunshine hours:
This is a count of how long the sun shines brightly and directly. The international standard counts a sunshine hour only while direct sunlight is above a set strength.8 When a cloud crosses the sun, the clock stops. Sunshine hours tell you how often you get a proper blue-sky day. - Solar energy:
This is the total amount of the sun's energy landing on the ground. It includes direct sunlight and the light scattered through the sky and bounced off clouds.9 NIWA (link) measures it separately from sunshine hours. This is the energy your panels turn into power.
One is a stopwatch. The other is a meter. The stopwatch only runs when the sun is out in full. The meter keeps counting all day.
That's why a bright, grey day can log almost no sunshine hours, while a steady stream of energy still lands on your roof. Scattered light from the sky is usually at its highest on cloudy days, and your panels use every bit of it.10
What the solar energy numbers show
NIWA publishes 30-year averages for solar radiation too.11 Here they are next to sunshine hours. We've shown the energy as kilowatt-hours per square metre over a year, the same unit your power bill uses.
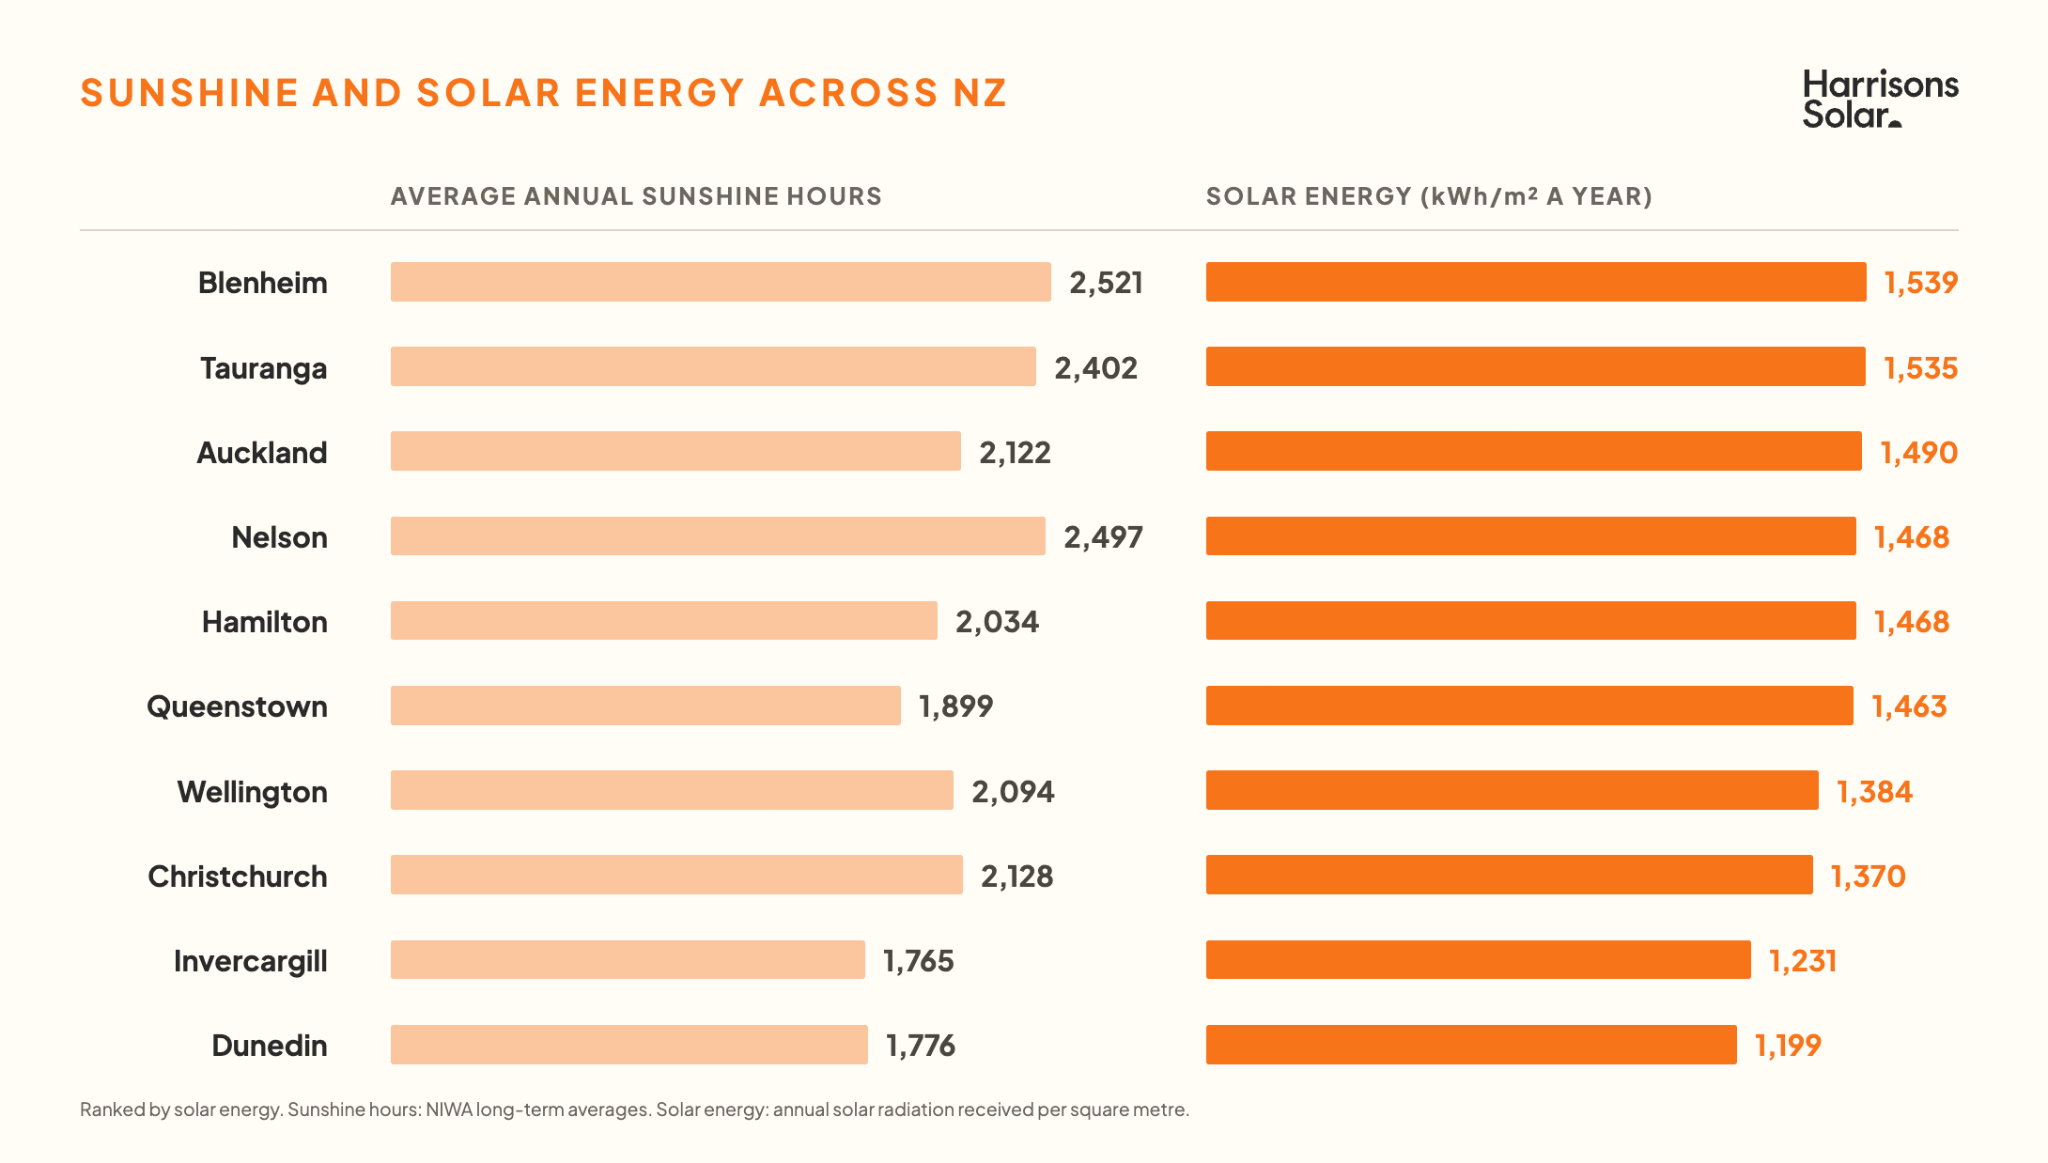
Line the two columns up and the sunshine table starts to look very different.
Nelson and Invercargill
Nelson gets 41% more sunshine hours than Invercargill, but it gets only about 19% more solar energy.
Queenstown and Nelson
Queenstown gets roughly 600 fewer sunshine hours than Nelson a year, and almost exactly the same solar energy.
Invercargill and Dunedin
Invercargill gets slightly fewer sunshine hours than Dunedin, but has more solar energy.
The hours tell you how often the sky is clear. The energy tells you what your roof has to work with, and on that measure the gap between the sunniest spots and the south is a lot smaller than most people think.
Why the south still gets plenty of energy
More energy from every hour of sun
Take Invercargill and London. Across a year, Invercargill gets only about 4% more sunshine hours than London. Yet it receives around 17% more solar energy, and the same solar panels would produce about 20% more power.12
Part of that is latitude. Invercargill sits closer to the equator than London, so the sun climbs higher in our sky. Our clean air helps too, and panels keep working on scattered light even when the sky isn't what we'd call sunny. Put simply, we get more out of every hour of sunshine than much of Europe does.
Long southern summer days
The further south you go, the longer the summer days. In December, Invercargill's average daily solar energy was within about 4% of Auckland's.11
Cool weather helps
Panels run a little more efficiently when they're cool. A crisp, clear Southland morning can be one of the best times of the year for your roof.
Sunshine you can plan around
Crowded House gave us Four Seasons in One Day, and anyone who's lived in Melbourne or Wellington knows the feeling. We tend to think of sunshine as unpredictable because tomorrow's weather is. But zoom out over a year and it's a different story.
New Zealand's sunshine and solar energy have been measured for decades,13 and the amount a town receives stays remarkably steady from one year to the next.14 That's more than you can say for plenty of things we make long-term money decisions around. Anyone with a mortgage or a term deposit knows interest rates can rise and fall a long way, and sharemarkets can swing sharply from one year to the next. The sun just keeps turning up!
That steadiness makes it easier to estimate what your panels will produce, and your local Harrisons Solar business owner can base the numbers on decades of local records.
Before you rule yourself out
Next time someone at a barbecue says New Zealand doesn't get the sun for solar, you'll know better. Our towns stack up well against some of the most solar-loving countries on earth, and your panels keep working long after the sunshine recorder stops counting.
Your local Harrisons Solar business owner lives and works in your area, so they know the local conditions your panels will be working in. They'll come round, size up your roof, and show you what a system could produce at your place. No rush, no pressure.
Book a free, no-obligation, on-site assessment, or give us a bell on 0800 00 33 55.
From top to bottom, we've got NZ covered!
Harrisons Solar - The Solar People
References
- Shihad: The Spinoff on Home Again
- Australian solar uptake: Clean Energy Council: Rooftop solar generates over 10 per cent of Australia's electricity (April 2024)
- SEANZ Industry Overview, Gareth Williams (COO), SEANZ conference, 3 September 2026.
- Solar adoption: Solar power in Germany, Solar power in the Netherlands
- NZ sunshine hours: NIWA Climate Averages, 1991-2020 (Figure.NZ)
- Australian sunshine hours: Current Results: Annual Sunshine for Cities in Australia (BoM data, 1991-2020); Bureau of Meteorology: Climate statistics for Australian locations
- Overseas sunshine hours, all 1991-2020 normals: Munich (DWD), Amsterdam (KNMI, Schiphol), Berlin (DWD), London Kew (Met Office), Hamburg, Dublin Airport
- Definition of a sunshine hour: the World Meteorological Organisation defines sunshine hours as the sum of the time intervals during which the direct solar irradiance exceeds a threshold of 120W/m², equivalent to the level of solar irradiance shortly after sunrise or shortly before sunset in cloud-free conditions.
- Global radiation: in NIWA's database it includes both radiation from direct sunlight and from diffuse (scattering) sources in the earth's atmosphere such as clouds.
- Cloudy days: diffuse solar exposure values are usually highest during cloudy conditions.
- NZ solar energy: NIWA mean daily global radiation, 1991-2020; NIWA: Mean daily global radiation
- Invercargill and London solar energy and panel output: Global Solar Atlas: Invercargill; Global Solar Atlas: London
- NZ climate records: NIWA: Climate stations statistics; NIWA: Solar energy (90+ measurement sites)
- Year-to-year variability: Solargis: Solar resource variability
Book your free quote
Book a free, no-obligation on-site assessment at a time that suits you. We'll size up your roof, talk you through your options without the jargon, and give you a proposal on the spot.

How we've helped our customers
Hear from customers on how solar has made a real dent in their power bill.



Get your Beginners
Guide to Solar
Download our guide to learn:
How solar saves you money
How a solar system works
If your roof is right for solar
How to choose an installer
And more